One of the most fucked up graphs I have ever seen. If it's possible to read it, which I'm not sure i'm doing correctly, doesn't it show that on average boss wins between 25 and 75 percent of the time with rates above and below average on each end? so a sort of average of 50%?
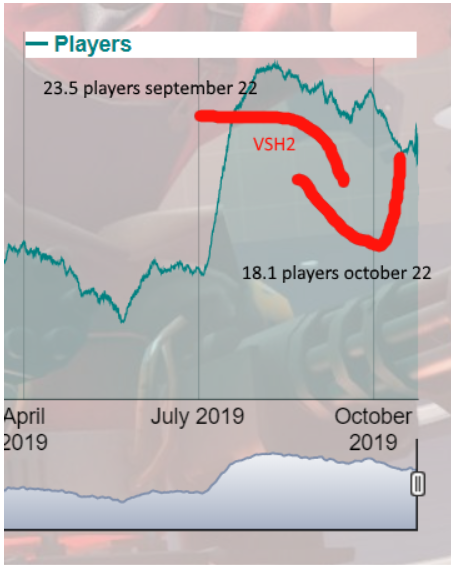
First chart shows a peak in activity during school summer breaks, which is expected
Second chart shows an increase since april, but still not as high as the peak which will always be summer break. Also are you taking into account people playing on halloween maps in October?
ALSO sep 22 was sunday, historically the most active day of the week in gaming, october 22 was a tuesday, which will never be as busy as a sunday.